
By Tom Mommsen (SSREC)
1 – Preamble
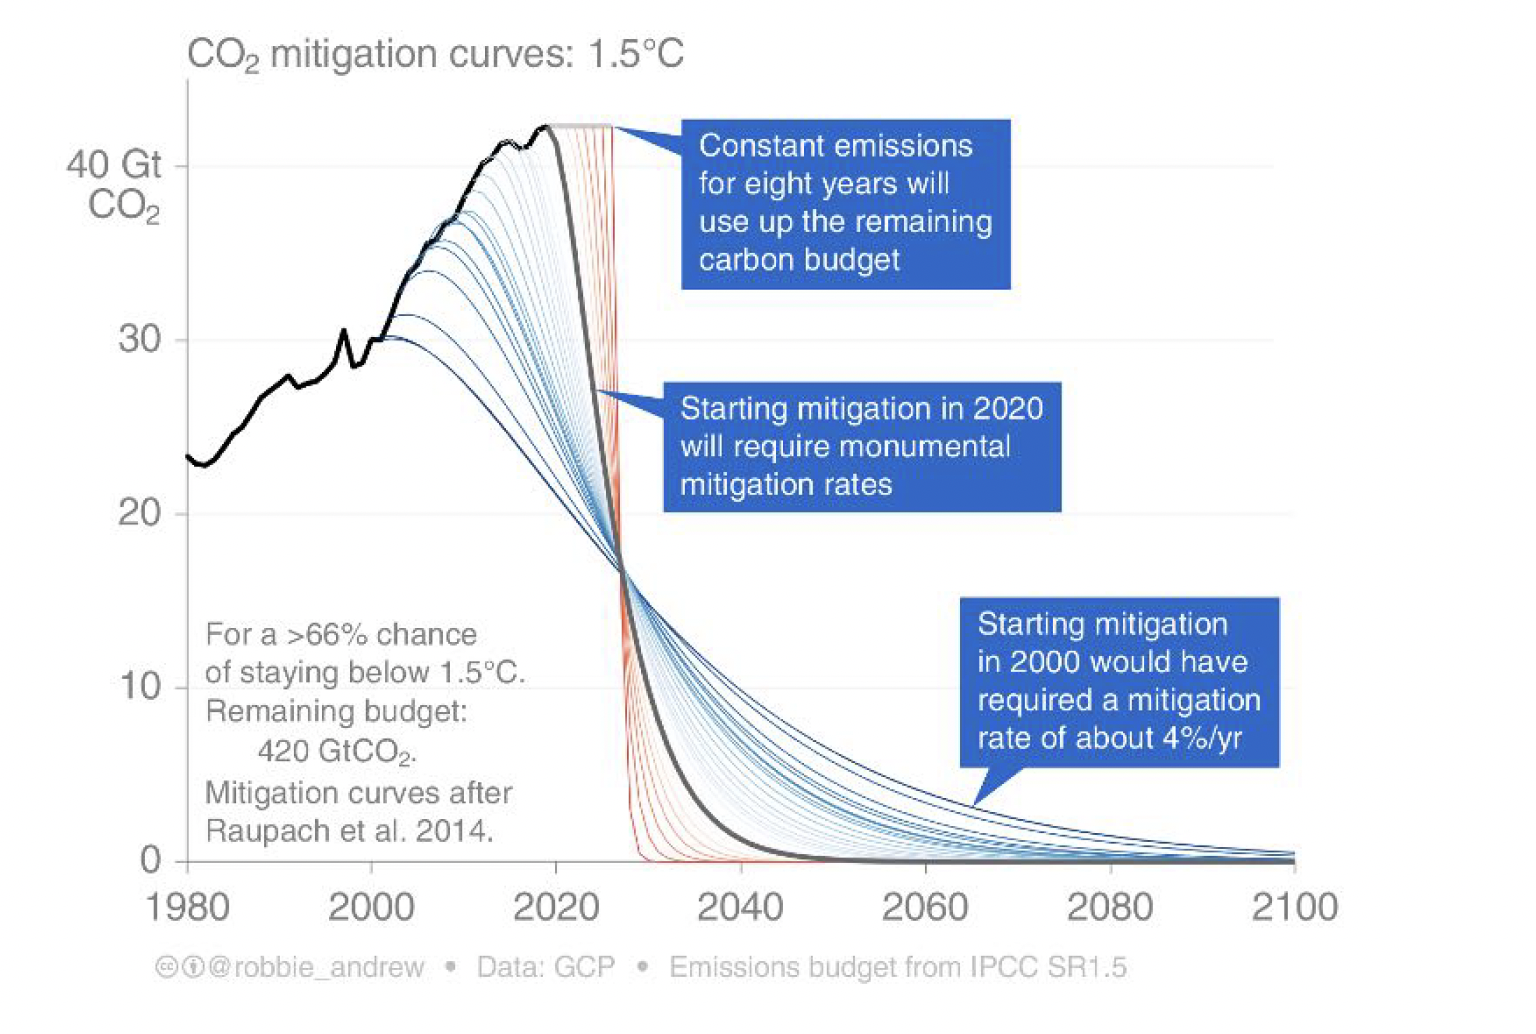
As made perfectly clear in the recent reports from the IPCC, the world must stop burning stuff. Not in 2025 or 2030. Now. When emissions reductions were discussed in the early noughts, an annual 4% decrease – mainly of carbon dioxide (CO2) – would have put the lethal climate crisis monster back on its chain. Lots of talk, hardly any actions and increasing emissions followed, especially in Canada. By 2020, that number had increased to 7.6% emissions reductions per year and must include methane; instead, the earth's atmosphere has seen a global increase of 6% in 2021, while still ignoring most large sources of methane. The planet has about seven years to get it together. No more delays. No more waiting for pies in the sky offering the perfect solutions.
Luckily, many powerful tools to mitigate the climate crisis, to decarbonize and to diminish its effects are already available: trees, eel grasses, mangroves, methane-munching bacteria, electricity from solar and wind, and electrified transportation, including electric vehicles (EVs), and of course, energy conservation, public transport, energy-saving housing and, first and foremost, abandoning the world's addiction to fossil fuels.
It's imperative to use as many of these tools as possible and use them wisely and properly. And, fortunately, they are not prohibitively expensive, especially considering what is at stake. In fact, one could argue that they are absolutely essential, considering what is at stake. However, none of these decarbonization routes support the status quo since they are clearly disruptive to business as usual. Thus, they are reviled by industries and their enablers busily perpetuating fairy tales about their own environmental prowess, banging on about transition fuels, praying at the altar of incrementalism, and by seeding misleading myths about their actions and the energy transition.
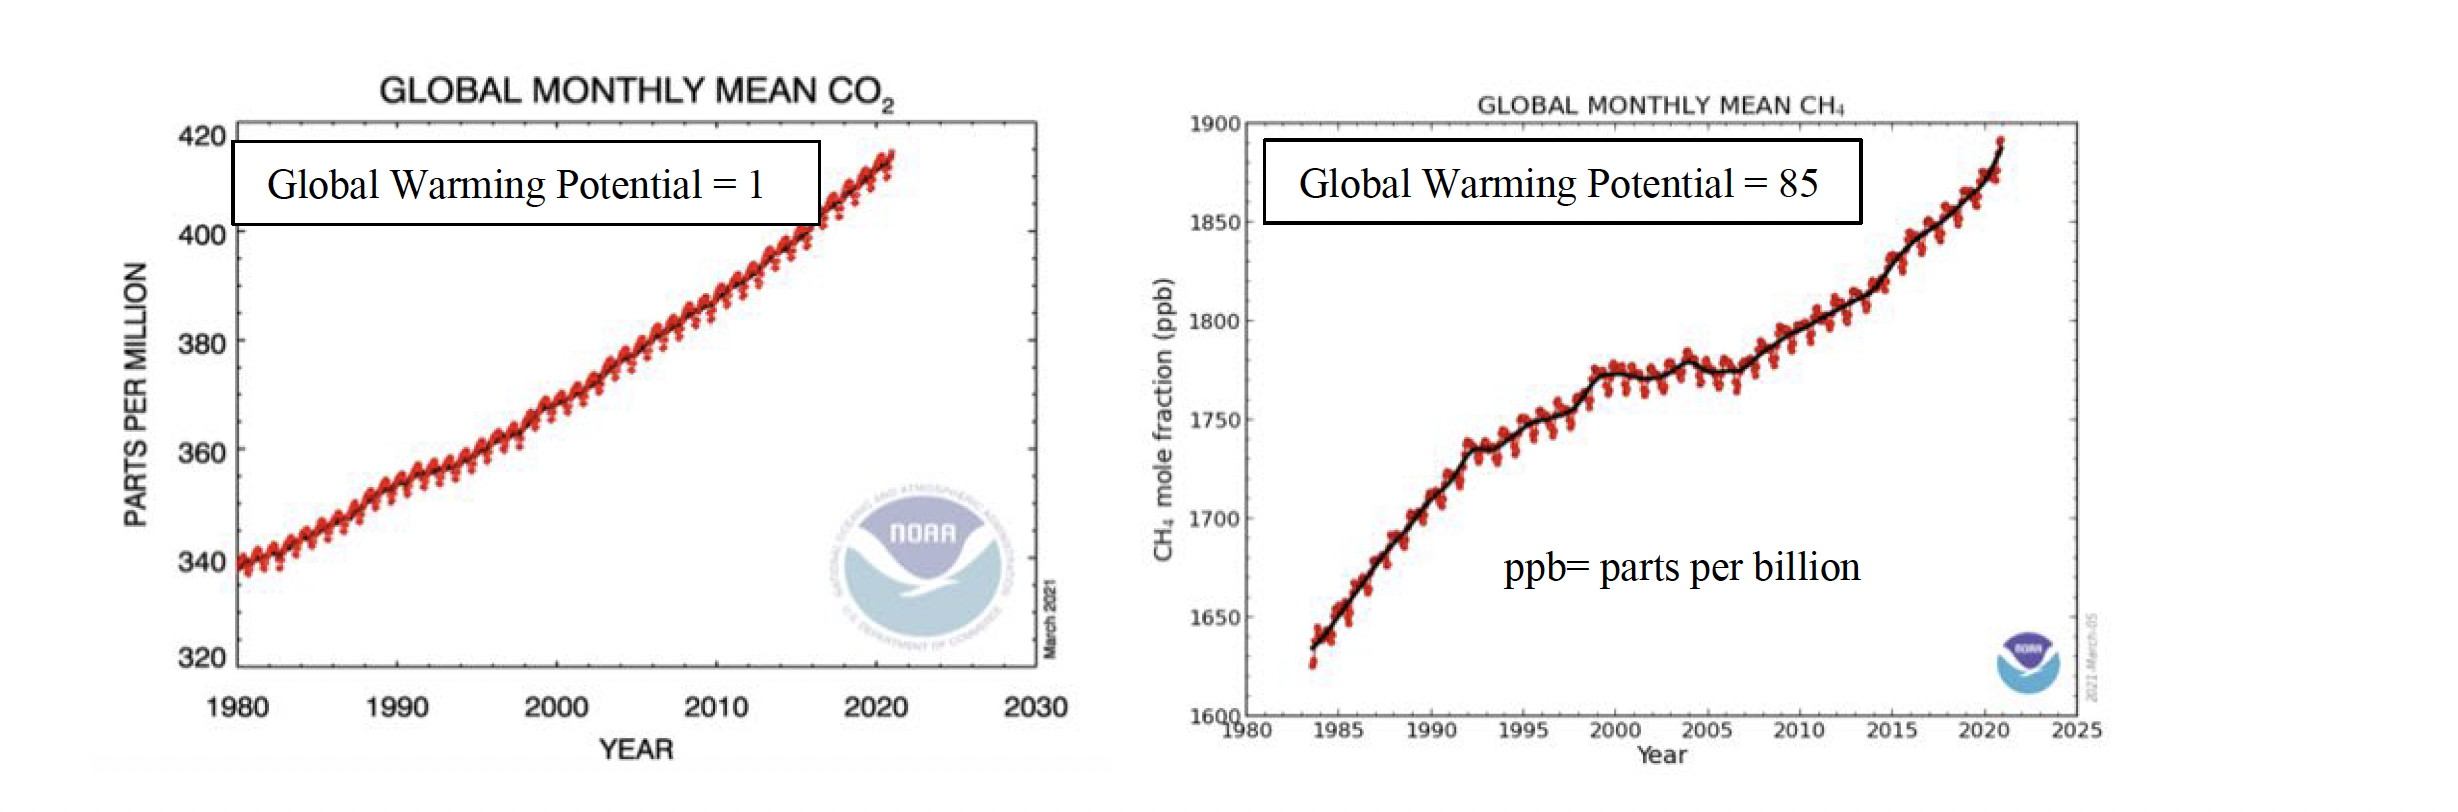
The globe has already experienced global warming exceeding 1.1 °C, while people are being deluged with inventively named, but frighteningly real, climate-change phenomena like atmospheric rivers, rain bombs, heat domes, derechos, fire clouds, together with more traditional ones – all reaching unprecedented extremes – like hurricanes, typhoons, water spouts, droughts, tornadoes and forest fires. And, of course, sea level rise and just for the record, the continuously rising atmospheric concentrations of carbon dioxide and methane, two of the most potent global warming agents. The one newly coined word that encompasses all of the above and the one we should be most worried about is 'carbon bomb'. The media focus on symptoms, when the problem lies squarely with the cause.
This may seem like an awfully long introduction for an article focussing on the role of solar and electric vehicles in decarbonization, but it is critical to setting a proper and urgent framework, since almost 30 % of all emissions are due to road transportation, with light-duty vehicles accounting for more than half, i.e. 17% of total. From this point on, the data will do the talking.
2 – The importance of efficiency in transportation
Canadians drive their vehicles a lot – some 15,000 km/year on average – about 25% more than citizens of the European Union (2019 data). Alas, from the 'oh, look over there, a squirrel' department, Canadians can always point South: the Americans drive even more (close to 24,000 km/year). That's shocking, but no reason to be smug – our Canadian small-vehicle stock is even slightly less efficient than that of drivers south of the border which is already fairly poor by global standards. Perhaps 'efficient' is not really the most appropriate word either, since according to some sources, the original Ford Model T had a similar gas-mileage as the current crop of allegedly 'highly efficient' SUVs. Admittedly, the modern brakes are better, the traveller's hair is less ruffled than a century ago and the ride is generally smoother. Yet, all that engineering research and development has culminated in more complex engines and perhaps a 1% increase in mileage in 100 years?
What a triumph! Prosecco all around – if it weren't for those tricky supply-chain issues. Clearly, this puts a new dimension to the meaning of 'incremental change' and sadly those changes were not really focussed on efficiency – just listen to the matchless sound of the driver's door closing in a high-end Mercedes!
The most worrying fact is that internal combustion engines still do what they were originally designed for: combust fossil fuels. Lots of it. Which produces greenhouse gases and we all know – including Exxon in the 1970s – that's not good for the planet. What really counts is what the atmosphere sees – it's quite irrelevant where or how those carbon dioxide and/or methane molecules are generated – last time we looked, we could not find any international borders for diffusing gases.
3 – A look at the past : Legacy internal combustion engine vehicles (ICEV)
Driving 15,000 km in a vehicle propelled by an internal combustion engine will combust around 1350 L of gasoline each year, using 9 L of gasoline for 100 km. Since the goal is to compare this number with vehicles using electricity, directly comparable and familiar units have to be used for energy such as the kWh, as found on electricity bills. According to Natural Resources Canada, those 1350 L of gasoline contain some 12,015 kWh (8.9 kWh/ L) of energy. In addition, the energy costs of producing one liter of gasoline from oil (well-to- tank), i.e. drilling, pumping, transporting oil, refining, transportation of gasoline, etc. need to be considered. (Notice that no costs are included for disposal of waste products, capping wells post-production, methane leakage from abandoned wells or remediating oil sands settling ponds, but those are different stories
altogether). All these secondary energy investments in gasoline add up to at least 20% higher energy consumption than given simply for direct combustion, resulting in 14,400 kWh/year. Just shy of 1 kWh for each km driven.
4 – A look at the (very near) future : Battery electric vehicles (BEV)
Driving a BEV for 15,000 km at around 5.55 km/kWh (a relatively low estimate for BEVs – some BEVs exceed 6 km/kWh) means that 2700 kWh are needed to drive the BEV for a year. Incidentally, that's about 27% of the electricity demand of the average BC household. As always – any shout-outs for the second law of thermodynamics? – there will be losses during energy conversions. High estimates for general losses converting DC to AC, during storage, energy transfers, etc. amount to 15%. All things considered, to run the BEV for a year will then consume about 3200 kWh (summarized in Table 1).
Table 1. Annual energy usage in internal combustion engine vehicles (ICEV) and battery electric vehicles (BEV)
Efficiency Distance travelled
Total fuel
Energy Losses
|
ICEV |
9.0 L/100 km |
15,000 km |
1350 L |
12,015 kWh |
Well-to-wheel 20% |
14,400 kWh |
|
BEV |
18 kWh/100 km |
15,000 km |
– |
2700 kWh |
AC-DC conversion etc. 15% |
3,200 kWh |
How is it possible that a vehicle propelled by fossil fuel consumes around 4.5-times more energy than a BEV to travel the same distance? The answer is simple and rooted in the immutable fact than in an ICEV more than three quarters of the energy in the combusted fuel is wasted as heat. Only 22% of the energy is actually converted into propulsion. Not an efficient way to travel. Admittedly, it's nice to have access to that normally waste heat in a Canadian winter, while those smug BEV drivers suffer decreased efficiency having to heat their batteries and the cabin from batteries which takes away from how far they can travel on a single charge. Ha!
Of course, in the summer when environmental heat is plentiful – and increasingly abundant with climate change, but that's a different story – the tables are turned: ICEV drivers need to crank up the air conditioning, which decreases their driving efficiency, while adding a lot of extra heat into the environment as well as carbon dioxide: a double curse for the climate. Some might call this a 'positive feedback loop', putting a softening linguistic spin on something really destructive to the climate. And, let's face it, we live an era of unbridled 'spin'.
Given the basic calculations in Table 1, three key issues have to be considered – with relative importance being subject to personal interpretation and discussion, although the evidence tends to speak loud and clear:
-
- Costs
- Emissions affecting climate change
- Environmental effects outside of climate change
5.1 – Comparative costs
It is straightforward to compare the cost for driving 15,000 km a year by considering the retail cost per L of gasoline versus the retail cost of a kWh (Table 1). Prices for fossil fuels are volatile and change with geopolitical events, taxation, subsidies and profit taking. In contrast, electricity pricing is relatively stable: in BC, the cost per kWh generally depends on BC Hydro, and needs approval of the BC Utilities Commission. BC also has five independent municipal utilities that control their own electricity pricing. In Table 2, pre- Ukraine war gasoline prices and blended BC Hydro residential rates from April 2022 are included. Because
the author is an unapologetic solar enthusiast – a day on a sunny beach does wonders to mental health (sunscreen recommended) – the cost of electricity from a small rooftop solar array is included (more on that below).
Table 2. Costs of driving an ICEV or a BEV for 15,000 km/year in British Columbia
|
Fuel |
Unit cost |
Total |
Annual cost |
Savings over ICEV/year |
Cost relative to ICEV |
|
|
ICEV |
Gasoline |
184.9 ¢/ L |
1350 L |
$2,496 |
– |
100% |
|
BEV |
BC Hydro Tier 1/2 |
11.33 ¢/ kWh |
3200 kWh |
$362 |
$2,134 |
14.5% |
|
BEV |
Residential rooftop PV |
6.0 ¢/ kWh |
3200 kWh |
$192 |
$2,304 |
9.2% |
|
total cost break-even point |
|||||
|
Solar Array |
3.0 kW |
$ 2.38/W 3200 kWh |
$7,140 |
3.0 years |
|
|
6-7 modules |
minus federal grant |
$4,140 |
1.7 years |
||
Massive advantage BEV. Again. Even when paying the highest (Tier 2) rate for electricity, running a BEV will be almost 80% cheaper than a comparative ICEV (see also Table 4).
But why stop there? Why not go solar? Generating those 3200 kWh to run an average BEV for a year requires a 3 kW rooftop solar array (5-8 solar panels) with reasonable solar exposure in most of BC. Due to regional differences in insolation, a 4 kW array may be needed in Haida Gwai'i, while a 2.6 kW array will do the trick in Hudson's Hope. A 3 kW solar array may appear expensive at around $ 7,200 to $ 8,000 (professionally installed and permitted, including taxes), but this has to been seen in perspective. Assuming gasoline costs return to around $ 1.60/L, that 3 kW array would pay for itself in 3.7 years – afterwards all driving will be free of energy expenses until those solar panels approach the end of their functional life, some 35 – 50 years after installation. Focussing on the present, the federal government offers a Canada Greener Homes grant that includes a $1000 grant for each kW of solar installed, decreasing the overall cost by $3000 and bringing the break-even point on the 3 kW solar investment down to 2.3 years. With the grant and gasoline prices hovering around $2.00/L, it takes 1.85 years to pay for the solar installation. It's like prepaying for less than two years of fuel, and then driving around for a few decades – for free!
5.2 – Emissions affecting climate
Unfortunately, 'emissions' is a contentious topic and takes us into slippery-slope territory, where estimates vary widely between industry statements and data gathered independently on the carbon intensity of eligible products. Added to this is a large dollop of greenwash, wishful thinking, obfuscation or PR. Therefore, resorting to the peer-reviewed scientific literature brings things into unbiased focus and the facts speak for themselves: Carbon emissions from fossil fuels (coal, oil, or fossil methane (NG, CNG, LNG)) and biomass are high, between 900 and 1200 g CO2e per kWh, while those for mega-hydro may be as low as 300 g CO2e per kWh. In large contrast, emissions from solar, wind and geothermal are less than 10 g CO2e per kWh. Quite a range. The emissions from an average annual travel distance (15,000 km) are summarized in Table 3.
Table 3: Emissions from vehicles with different propulsion methods relative to electricity generated from rooftop solar
|
'Fuel' |
'Fuel' total/year* |
Emissions/unit |
Emissions/year |
Relative to solar PV |
Learning Curve |
|
|
ICEV |
Gasoline |
1620 L |
2,300 g CO2e/L |
3105 kg CO2e |
149.3 |
no |
|
electricity from: |
||||||
|
Fossil Methane, Coal, Biomass |
3200 kWh |
~900 g CO2e/kWh |
2880 kg CO2e |
138.5 |
no |
|
|
BEV |
BC Grid** |
3200 kWh |
330 g CO2e/kWh |
1056 kg CO2e |
50.8 |
no |
|
Wind |
3200 kWh |
5.0 g CO2e/kWh |
16.0 kg CO2e |
0.8 |
yes |
|
|
Rooftop solar |
3200 kWh |
6.5 g CO2e/kWh |
20.8 kg CO2e |
1.0 |
yes |
|
*'Total fuel' includes emissions from refining, AC-DC conversions etc.
**Does not include line losses (ca. 10%) from generation site to end user
Since planet earth neither has active X (previously: 'Twitter') or TikTok accounts, nor is it known to purchase advertising during events (many of which have direct effects on GHG emissions – Formula 1 anyone?), these data do not make the list of important discussions on any network, traditional or newer age. Yet, they definitely should since energy is absolutely critical to modern life and anything related to energy should be examined through a 'carbon lens'. Hmmm. Come to think of it, what exactly is the carbon footprint of flying an F1 race car from Saudi Arabia to Australia? Oh no, why is the author picking on F1? It's just an obvious target, since blaming a daily commute by car or a local flight does not carry the same Wow!-effect as the carbon footprint of a pampered race car (an ICEV!) travelling half the way around the globe. Turns out, those short individual trips (commuting or flying) have a much larger overall impact on the climate than that maligned F1 vehicle. In fact, British Columbia's three million small vehicles alone generate 20,000 times more CO2 annually than an entire F1 season. Ouch.
Back to rooftop solar, a.k.a. photovoltaics (PV). Sadly, there are no free lunches, and solar is not emission- free. PV contributes emissions, tiny as they are, due to mining, refining, manufacture, and transportation, etc, but it doesn't emit GHGs during actual operations. Further, subtle differences exist in the way emissions from gasoline and solar reach the atmosphere. It's straightforward for ICEV: every year, 1620 L of fuel are combusted, and some 3.1 metric tonnes of CO2 are added to the atmosphere.
If solar PV is feeding the BEV, the energy expenditures/emissions are 'front-loaded', i.e. all energies for manufacture etc. have occurred by the time the solar module has been installed. At the beginning of its functional life, the solar module has already incurred the module's life-time emissions, an 'emission debt', of sorts. For the 3 kW PV array the total energy (embedded and combusted) amounts to less than half a tonne (455 kg) of CO2e emissions. However, put into context, the ICEV will have caught up with a BEV's life-time emissions in less than two months. After those two months, the solar-powered BEV is emission-free, while the ICEV keeps piling up its substantial emission debit account, to the clear detriment of the earth's atmosphere and climate, and to the tune of 3.1 metric tons of CO2e annually.
Note that the sites of emissions (mining, transporting, refining, manufacture, transporting, assembly, etc.) for solar PV are separate from the site of use. Once installed, solar modules will not contribute any further emissions during the long life-time of the solar module. The life-time emissions translate into a carbon debt that needs to be repaid, since no matter where the modules are put into use, the atmosphere will have 'seen' an increase in carbon emissions from PV manufacture, even if it is relative small. However, the treatment we use here is much more honest, complete and straightforward than the twisted arguments to continue fracking for gas (methane), followed by export of LNG. Strangely, only the emissions from gas exploration, processing and transporting count towards the nationally determined contributions (NDCs), while it is entirely up to the
target countries how they deal with the emissions from combusting imported fossil fuels. It's like the producers are washing their hands of the really dirty portion (combustion) of their deeds.
Reaching close to zero carbon emissions is obviously easiest with a solar array propelling the BEV. However, PV's finite, small carbon footprint really needs to be compensated, not just for the feel-good factor, but more importantly to reach the net-zero goal. How about planting a single tree, perhaps a Douglas fir? Alas, it's a long-term project, since in the first 25 years of growth, the spindly tree will absorb only a small amount of carbon dioxide from the atmosphere, but increasing amounts every year after. About 40 years later, when fully established, though still in its youth, the tree will actively sequester more than 60 kg carbon dioxide annually and store it in its trunk and roots, eventually reaching and then surpassing – perhaps at the young age of 60 – the carbon debt of those solar modules. Of course, a mature forest has additional positive attributes, among them amazing biodiversity, keeping the forest floor cool, resistance to burning, producing oxygen, regulating the water table and pleasing esthetics, but only as long as the tree remains alive. 'Harvesting' would immediately negate all the past carbon-capturing efforts by that tree. Unfortunately, while waiting for the tree to catch up with its carbon capture duty, both the solar array (life expectancy 35-50 years) and the BEV (???) will have expired and been replaced with newer and shinier models. Plant another tree? Better to plant two or three trees for every small solar array now, just in case, and to carbon-proof for the future, at least for the transportation aspect.
In stark contrast, to approach net-zero carbon for a single ICEV would require planting an acre of trees to – eventually – make up for those 3.1 metric tonnes of CO2e produced annually.
Table 3 includes a cryptic column called 'learning curve' that requires explanation. Technologies with so- called learning curves are common, indicating that manufacturing costs decrease as production volume rises, with each doubling of production resulting in cost decreases in the 10 % to 15% range. We're used to this for computer memory. This also neatly applies to batteries, wind turbines and PV, where every time global production is doubled, costs decrease by a double digit percentage – not that those savings are necessarily passed on to the consumer – supply-chain issues! Nudge, nudge, wink, wink. For solar, emissions follow the same pattern and will be well below 4 g CO2e when solar profusion will quadruple in the next few years.
While solar, wind, and battery storage all have positive learning curves, legacy power generation (hydro, coal, fossil gas, nuclear) do not enjoy this advantage – in fact large cost-overruns tend to be part and parcel of most of those industries.
Regarding emissions, three major conclusions can be drawn from Table 3.
- A grid fueled by fossil gas, coal or biomass is as carbon intensive as gasoline, with marginal differences. For fossil gas (methane), any presumed advantages disappear as soon as fugitive emissions and methane's large global warming potential (Fig. 2) are considered.
- Putting hydroelectricity at a 50-times higher carbon intensity than wind or solar seems to contradict the emission-free myth perpetuated by the international hydroelectricity industry. In reality, big hydro installations release large amounts of carbon dioxide and – worryingly – a lot of methane during the lifetime of dam and reservoir as reported by a constantly growing body of peer-reviewed scientific evidence. These studies quantify greenhouse gas emissions from reservoirs during normal operation, reservoir drawdown and turbine passage. Operators of large dams usually report on GHG emissions only during construction, conveniently ignore the biomass removed or flooded which would have sequestered increasing amounts of carbon dioxide if left undisturbed. They certainly never even think about the hidden methane bombs accumulating in the reservoir's sediment that will be released during operation or at the end of the reservoir's functional life.
- Neither (a.) combusting fuels nor (b.) hydropower are a match to electricity generated from solar or wind for emissions. Not even close. Leading to the conclusion that decarbonization of transport should be largely based on solar and wind electricity, with a huge, and as important, immediate impact.
An ICE vehicle driving the same distance as a BEV will emit well over 100 times more greenhouse gases than an EV, i.e. at least 31 tonnes of GHGs over ten years compared with 210 kg (0.021 t) CO2e for the BEV.
5.3 – Environmental challenges outside of climate change
A large number of environmental effects puts BEVs well ahead of ICEV, and it is up to the reader to evaluate their relative strengths and weaknesses. The few examples in Table 4a&b are presented to invigorate the debate and are dominated by non-exhaust emissions. Until the advent of BEVs, those emissions had been dwarfed by the direct emissions from combustion of fossil fuels. Therefore, finally and long overdue, discussions have started focussing on brake wear, tire wear, road wear and dynamics around road dust, encompassing the previous three.
Table 4a: Internal combustion engine vehicle (ICEV) vs. battery electric vehicle (BEV)
|
General |
ICEV |
BEV |
|
Moving parts |
~2500 |
~25 |
|
Engine/Motor warranty |
100,000 km |
160,000 km |
|
Embedded energy |
similar |
|
|
Consumables |
12 V Battery Tires Brake pads (60,000 km) Engine oil Transmission fluid Radiator fluid Air & oil filters Radiator Transmission Exhaust system – |
12 V Battery |
|
Tires |
||
|
Brake pads (260,000 km) |
||
|
– |
||
|
– |
||
|
– |
||
|
Air filter |
||
|
Parts needing replacement |
– |
|
|
– |
||
|
– |
||
|
Battery pack (> 8 y life cycle) |
||
The examples include regenerative braking that recycles kinetic energy and massively reduces emissions of toxic brake pad particles, and risk reduction in potential failure due to design simplicity of BEVs compared with ICEV, going hand in hand with warranties on propulsion type. Since brakes are rarely used in BEVs, some manufacturers are even planning to replace (expensive) rear wheel disk brakes with traditional drum brakes that are sealed and do not release any brake dust into the environment. Unfortunately, this still doesn't make the brake dust go away entirely, but it is reduced and now confined to point sources rather than the broad environment. Finally, we have found an area where environmental necessities and business acumen (using a cheaper solution for better environmental outcomes) converge.
Table 4a also mentions the reality that spent EV batteries (> 8 year warranty, unknown life cycle) can enter second lives as stationary storage for grid applications (adding about 20 years to functional life). Plus they are fully recyclable at their end of life. Thus, these batteries are feeding into the circular economy, something that none of degraded components of ICEV do.
Another observation is slowly making its way into the headlines as traditionalists are desperately dredging/trawling/trolling around for something shocking to say about BEVs: the effects of the mass of BEVs with their heavy batteries on roads themselves and nasty emissions/particles coming from tires. Strangely, this was not much of a consideration in the media when the average mass of small vehicles increased as the – especially North American – market embraced those hefty SUVs and ever larger and heavier pickup trucks.
But here we are: now BEVs are the baddies. Indeed, they are. The intricate web of mass and other effects are listed in Table 4b.
Table 4b: ICEV vs. BEV – environmental considerations
|
ICEV |
BEV |
|
|
Environmental |
||
|
Brake dust |
100% |
20% |
|
Spent battery |
Recycled |
Recycled |
|
Spent battery pack |
– |
2nd life in stationary applications (>20 y), |
|
followed by recycling |
||
|
Engine oil disposal |
9.5 billion L/year* |
– |
|
Particle emissions from tires1 |
High (1.0 x) |
20% higher (1.2 x) |
|
Relative impact on road1,2 |
Mass-dependent (1.0 x) |
Mass-dependent (1.2 x) |
|
Fires per 100,000 vehicles |
1530 (60 x) |
25.1 (1.0 x) |
|
Noise – propulsion |
48 dB |
28 dB (warning sounds 43-64 dB) |
|
– aerodynamic |
somewhat higher |
somewhat lower |
|
– tire-pavement |
similar |
similar |
|
Emissions – particulate matter |
yes |
no |
|
– nitrogen oxides (NOx) |
yes |
no |
|
– uncombusted fuel |
yes |
no |
|
– urban heat island effects |
yes |
no |
|
Co-benefits |
– |
vehicle to grid/house/load capability |
|
– |
emergency power backup |
|
|
– |
integration with renewable energy |
* annually disposed motor oil in Canada & USA: 40% dumped or burnt vs. 60% collected or recycled
1 increases to the power of 4 with axle load
2 comparisons: Hummer H2: 21x; Class 8 Semi: 410 x
Do BEVs destroy the roads and fill the air with toxic tire particles? Yes, in fact, all vehicles do. BEVs tend to be heavier than traditional ICEV, but not by as much as the media seem to imply. For instance, the Hyundai Kona can be purchased as a hybrid (1376 kg) or a BEV with a 39 kWh battery (1535 kg) or with a 64 kWh battery (1685 kg). It should be kept in mind that having access to a larger battery increases the efficiency of regenerative breaking, balancing lowered brake dust against increased tire and road wear. Choose your poison.
Using the Kona hybrid as a baseline, relative tire emissions and road wear are 1.00, 1.57 and 2.21 for the three Kona models. Yes, significant, but somewhat restrained compared to Ford pickup trucks: Ranger (3.62), F150 (11.5) or Lightning (21.0). Of course, it could be worse, like a comparison with a Hummer H2 (6.2 L engine) at 22.6, or an unloaded Class 8 truck at 410 times the mass effects on road etc. compared with a Kona hybrid. Since road wear and dust rise with the fourth power of axle load, trucks clearly dominate, and concern public health officials, with passenger cars more or less a rounding error. Still large, long-range passenger BEVs and large pick-up trucks, including those with electric drive trains, should worry road designers. However, this unfortunate development should be ameliorated over time as battery chemistries continue to improve with special emphasis on reducing battery weight, while increasing power & storage. Of course with much faster charging times, the 'need' to carry around enough battery mass to drive more than 400 to 500 km in one go while wildly exceeding the carrying capacity of the human bladder, will decrease.
There are additional aspects of going electric that are harder to capture in nice images or sound bites, like cleaner air, a quieter environment, no more whiffs of diesel or gasoline, and massively reduced levels of transportation-related pollutants, like nitrogen oxides (NOx), black carbon, smog, and ozone that directly, or indirectly affect health of city dwellers.
A sustainable society cannot afford to squander so much energy. How did we ever get to this point, where we accept an 80% energy loss? Wasn't capitalism supposed to evolve to make everything as efficient as possible?
Looks like something went wrong, and we've reached a point of maximum waste, since every kWh wasted still has to be paid for. Strange that society has come to accept this as if it was a physical constant.
Isn't it time to change the paradigm? And this is where residential solar enters the discussion and disrupts everything. Suddenly, a person with solar is no longer just a consumer (to be taken advantage of), but a consumer who knows something about energy and more importantly, is also a producer of energy generated locally – distributed and free of emissions. Transportation is both decarbonized and rendered independent of the geopolitical vagaries around energy. The power of energy, is shifted to local resilience, energy security and the ability to address energy poverty and equity. Should surplus production be fed back into the grid and go to the utility, or perhaps, be stored for later use in a stationary battery, or fed into the grid when demand (and prices) are high? Ah, storage, the next level of empowering all those people who traditionally were consumers only. Now, in addition to being producers of energy, the originally meek consumers are now traders of stored energy as well. And the evolution continues with the addition of movable electrical storage,
a.k.a. BEVs, where their batteries can serve to stabilize the grid, as emergency backup and deployment of times of peak demand on the grid!
[pdf-embedder url=”https://ssrec.org/wp-content/uploads/2023/09/Electric-vehicles-and-solar-energy-by-T-Mommsen.pdf” title=”Electric vehicles and solar energy by T Mommsen”]

You must be logged in to post a comment.