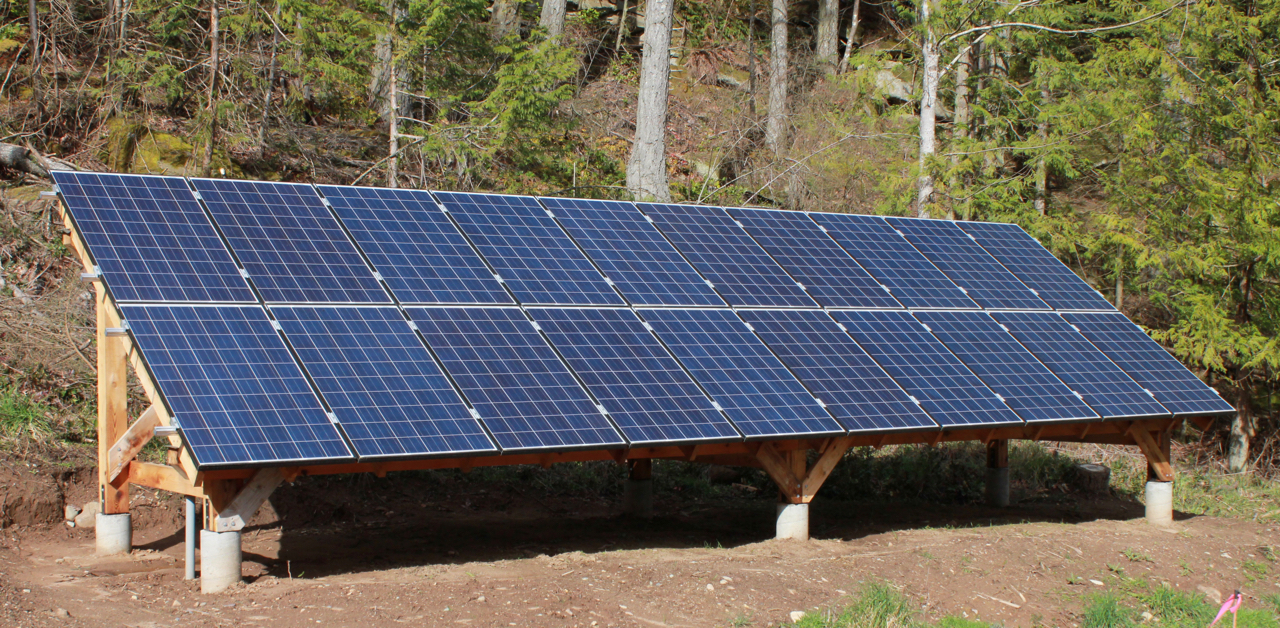
Live from Galiano Island, BC!
Below is a live APsystems Energy Monitoring and Analysis (EMA) dashboard that comes with a grid-tie installation.
The charts show the energy being produced by this system today, in the past week and in the past year.
Peaks are when the sun is out and valleys are when clouds pass over.
For reference, a 60W (0.06kW) incandescent light bulb operating for 12 hours consumes 0.72kWh of energy.
Don’t see a chart below? Please open with Chrome, Firefox, Brave or a browser other than Safari. You may have to adjust your security settings.
We recommend opening with Google Chrome.

Total Views: 3,438
